Facility
The Nasu radio observatory is located at the Jiyu-Gakuen Nasu Farm in Tochigi Prefecture, 160km north of Tokyo. Based on a unique idea of spatial fast Fourier transform (FFT) interferometer, a one-dimensional array consisting of eight linearly aligned antennas with 20 m spherical dishes was built at the observatory in 2000. This type of interferometer was developed to survey transient radio sources with an angular resolution as high as that of a 160 m dish with a field of view as wide as that of a 20 m dish. Main parameters of the Nasu telescope array is listed in the table below.
| Location | Latitude: 36 ° 55' 41.3" north, Longitude: 139 ° 58' 54.3" east |
| Number of antennas | Eight with 21 m spacing (E-W) |
| Main reflector | Fixed 20 m spherical dish |
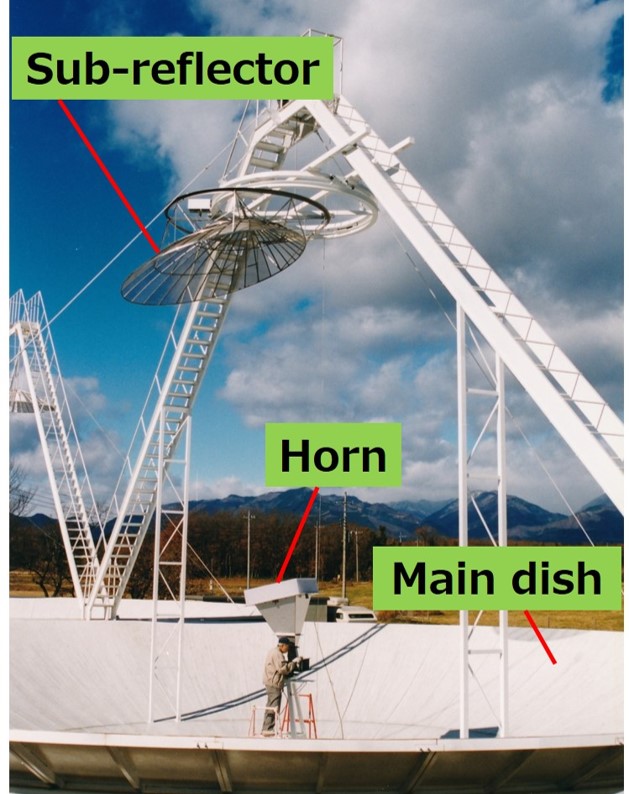
| Sub-reflector | Asymmetrical Gregorian type |
| Angular resolution | 0.1 ° (E-W) |
| Field of view (HPBW) | 0.8 ° |
| Declination coverage | 32 ° ≤ δ ≤ 42 ° |
| Frequency range | 1.415 ± 0.01 GHz |
| Nyquist frequency | 20 MHz |
The main part of each antenna is a spherical dish with a diameter of 20 m. For an incoming radio wave, the spherical surface of the main reflector and a Gregorian sub-reflector form a focal point at the input of the feed horn. The main dish is fixed on the ground, whereas the sub-reflector and feed horn can be moved mechanically. The sub-reflector is located 5 ° from the vertex axis of the spherical reflector, and thus, the elevation angle is fixed to 85 °. By rotating the sub-reflector synchronously with the feed horn in azimuth, the antenna covers the sky area in a declination zone of 32 ° ≤ δ ≤ 42 °, which is 7.0 % of the entire sky. Daily observations are being performed with drift-scan-mode, in which the telescope scans the sky around a selected declination line as the Earth rotates.
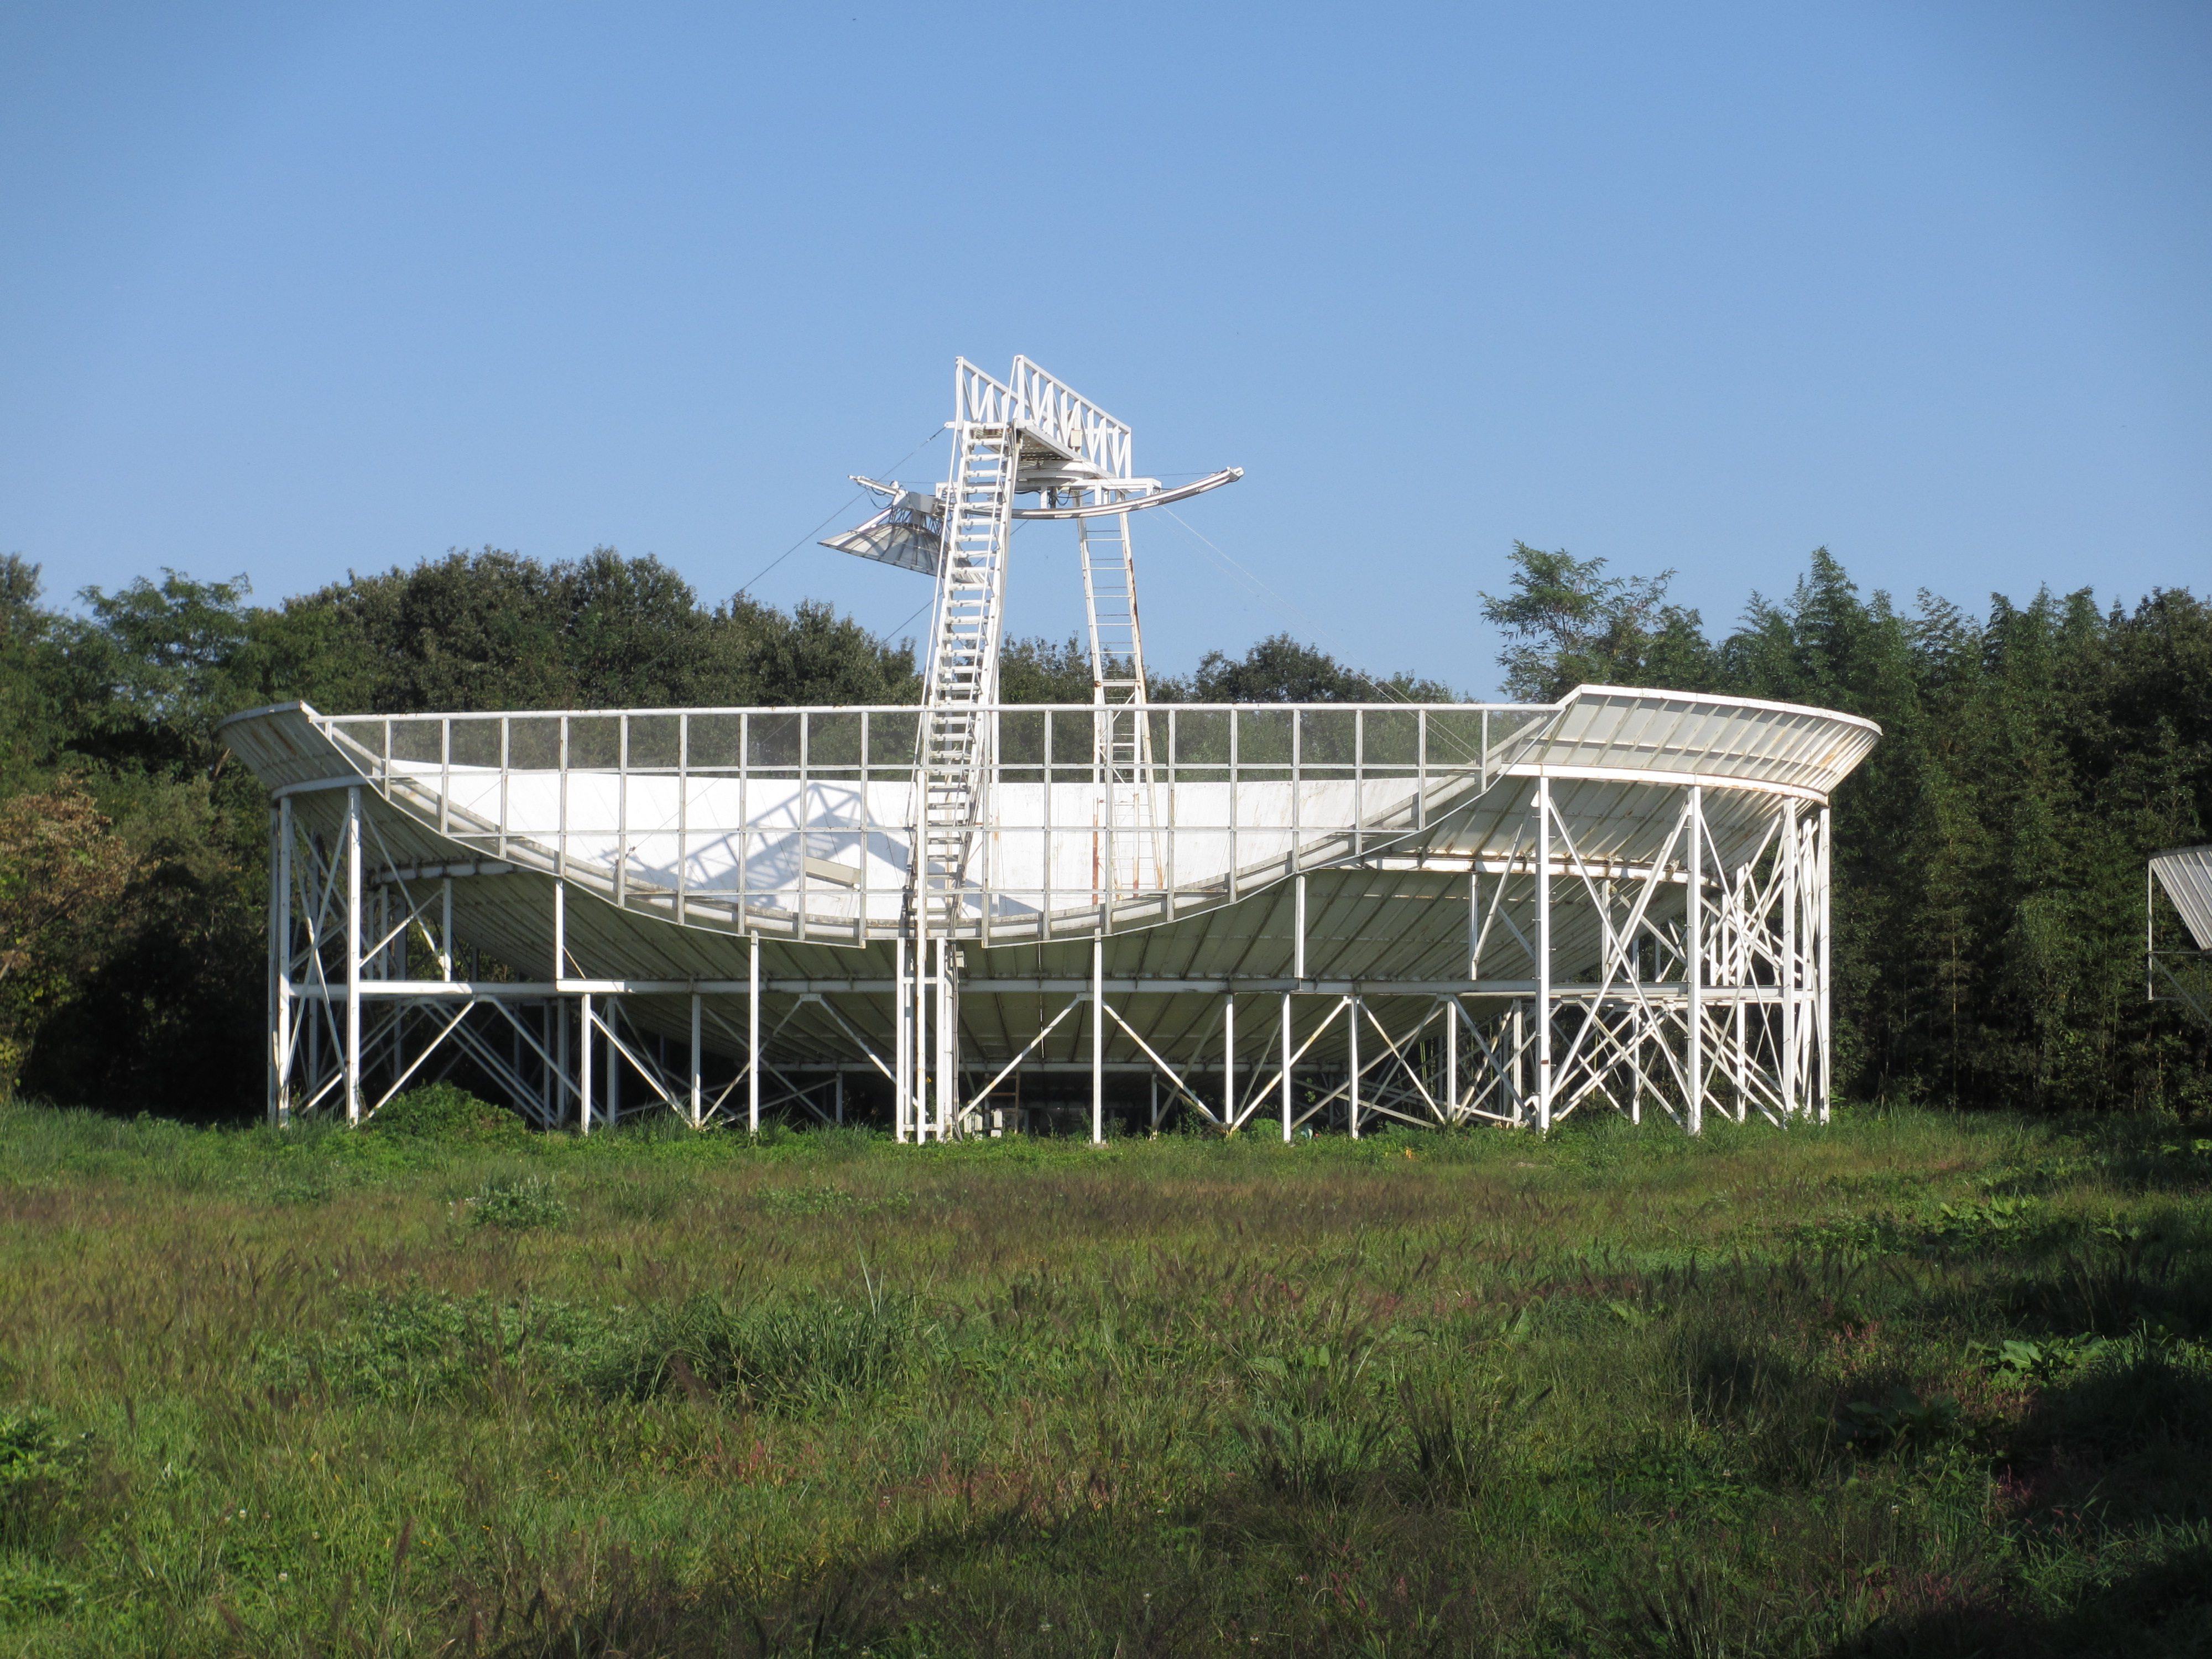
A 30-m diameter antenna is also installed in the observatory for the study of continuous radio sources such as Crab pulsar.
Objectives
The main purpose of the Nasu Telescope Array is to deepen our understanding of the physics around compact and dense astronomical objects by observing their behavior through radio waves.
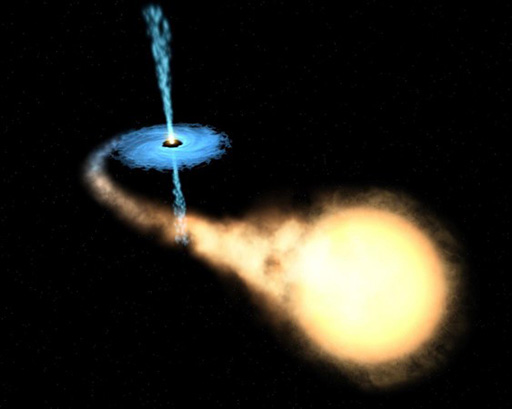
Among the features of the Nasu Telescope Array, the wide field of view and high resolution are very useful for the observation of transient phenomena. One of such transient phenomena is caused by microquasars such as V404 Cygni or Cygnus X-3. Radio waves emitted from active source can bring us rich information on the nature of the interaction between core object and its surrounding matters.
Principle
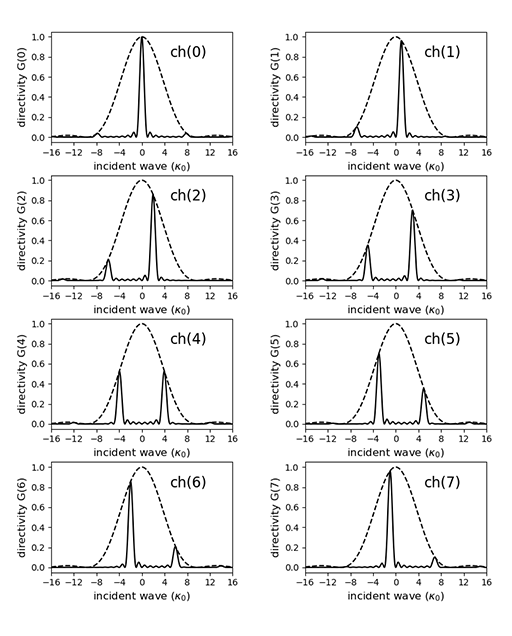
In the spatial FFT interferometer, the eight-channel complex output x(k) (k=0, 1,...,7) from each antenna is spatially Fourier transformed to produce vector X(k). Then, the time-averaged vector amplitude ch(k) (k=0, 1,...,7) is calculated and sent to the storage device for the later data analysis. Each ch(k) has its own directivity pattern as shown in fig.5. Here, the solid line shows the antenna pattern for each ch(k) and the broken line shows that of a single dish.
On the basis of the characteristics of the directivity pattern, two analysis methods have been developed: one is direct imaging and the other is correlation analysis.
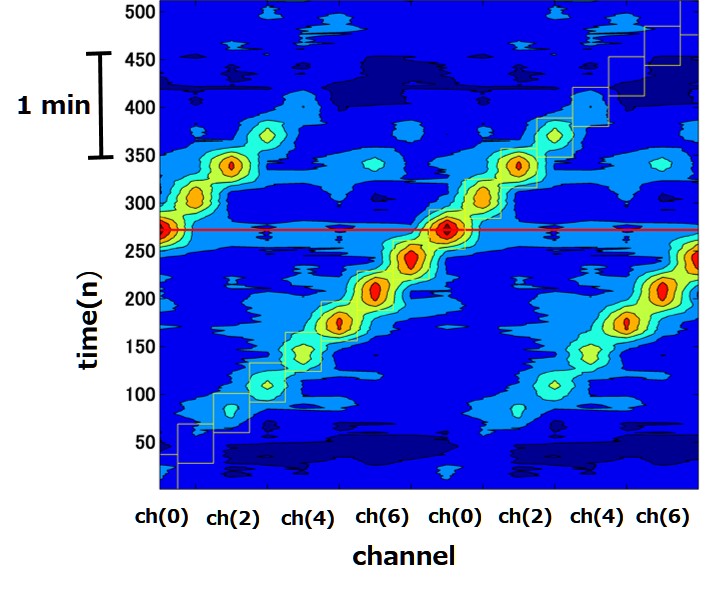
(1) A direct image can be obtained by making a contour map on the array block of ch(k). An Example of direct image produced by the bright radio source 4C 33.57 (1.1 Jy at 1.4GHz) is shown in fig.6.
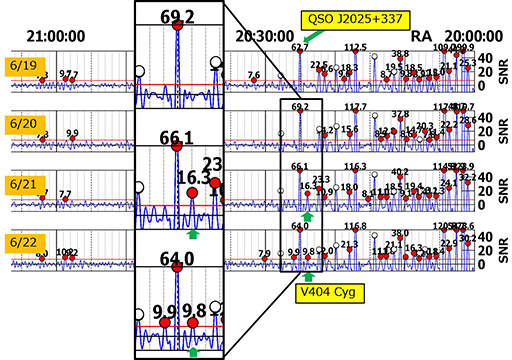
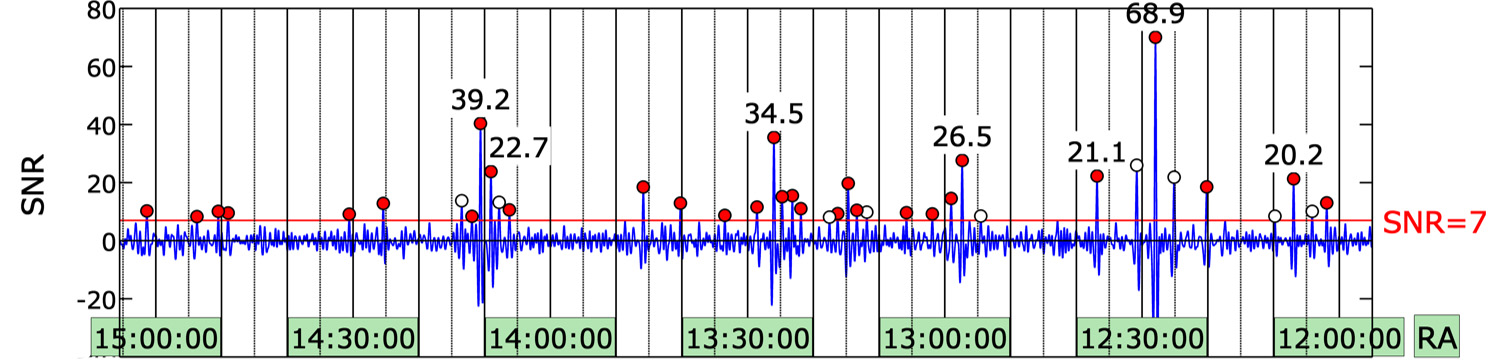
(2) As shown in fig.5, each ch(k) has its own antenna pattern. We can therefore find signals buried in an output stream by using correlation analysis or a pattern-matching method. This technique is a very powerful tool in the data analysis of gravitational waves. An example of three-hour data analyzed by the pattern- matching method is shown in fig.7. The figure shows the reduced SNR (signal-to-noise-ratio) of the 8-ch output data. SNR peaks larger than 7 are marked with a small circle, and the values shown at the peaks are the observed SNRs. You can think of large SNRs as meaning the actual radio sources.
Observations
One of the distinct demonstrations of the Nasu Telescope Array was the observation of V404 Cygni in 2015. The detector was able to record the sudden appearance of bright source as shown in fig.8. That was a new outburst of the black hole X-ray binary V404 Cygni after a quiescent period of 26 years. Using the above telescope, we had been monitoring V404 Cygni daily from one month before the outburst. Therefore, we were able to observe the new activity of V404 Cygni at 1.4 GHz. Because of the interest in black hole binaries, a considerable amount of data on this outburst at all wavelengths was accumulated. Our 1.4 GHz radio data are expected to be helpful for studying the physics of the accretion and ejection phenomena around black holes.